5. JasperReports
This documents covers some of the most basic topics on how to create reports with JasperReport and integrate them with our project.
5.1. Quick introduction
JasperReport is an open-souce Java-based reporting tool that helps create reports in a wide range of format such as: pdf, html, csv, xml, words, excel...
More information is available on their official web site.
5.2. Jasper & APSAT
So where are Jasper’s roles in our reporting product? Let take a look again at our architecture to refresh the idea
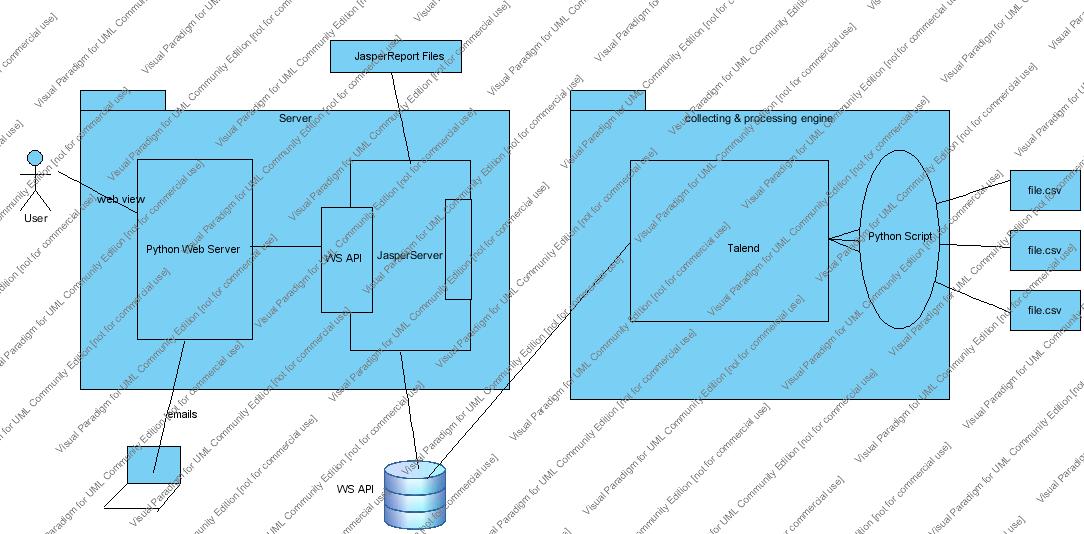
and the list of reports that we would like to send:
- The real-time reports
- The periodical reports
- The OLAP reports
The Jasper is directly responsible for generating the periodical reports that would be sent over through email. The user will find the links to the resources to download, meaning that we will reduce dramastically the amount of data transfer over the network.
The supposed by default file formats are: csv, pdf et html.
5.3. Jasper & Tools
Fortunately, the Jasper comes with a very rich resource of free tools to expend the Jasper’s capacities and improve the work performance. We might cite here the must-have ones:
- iReport: a standalone graphical program that provides report designer capabilities, and is able to run reports using all data source supported by the JasperReports engine.
- JasperServer: the interactive Jasper report server, based on Tomcat. We can build the report using iReport and then deploy it to the JasperServer then it wil be executed, exported to a desired output, or scheduled to execute at a later date.
The JasperServer is supposed to come with a working version of iReport.
5.4. Tutorial on working with Jasper
In order to create a Jasper report, one has to go through these following steps:
- define the content of the report: obviously this has to be the first things to do.
- then define the layout of the report based on the content
- define the resources needed to create the report: images, datasource...
5.4.1. Tuto - How to use iReport to create a report and then deploy it into the JasperServer
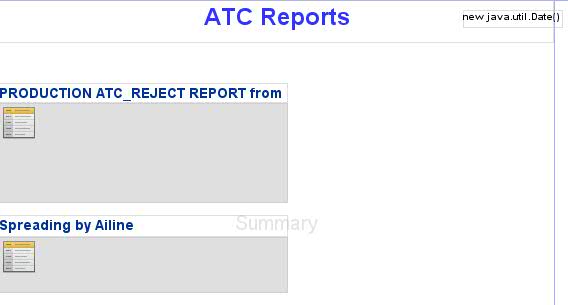
What we want here is to make a report with 2 sections: the first one is a fixed-size table containing the top 4 errors, grouped by transaction code and then other is a floating-size table holding rejected transaction grouped by airline name.
5.4.1.1. Create the project
Fire up the iReport application and then create a new report. We choose here a blank A4 and then proceed. We have to first make sure to delete all the bands except for the Summary in which we will put our elements.
We can now drag and drop a static fields onto the page as the title and maybe some dates and one by one 2 sub reports, each will have the table in it. The rule of thump here, as like seperating the reponsability, is to create a new sub-report whenever we want we include something complex. Make sure to check the ‘Position Type’ ‘value equals ‘float’ to prevent from reports eating up other’ space.
The figure below showing capture of the project main page.
and in each subreport, after getting rid of all the band except for the summary,
Clicking on the datasource def button firing up the wizard where we can define the database used in our report (address, driver, port, usr, pwd...). Click on the wizard button and then test. If if says ok then we’re good to proceed
On top of the each there’s a button used to define the report query where we define our data source & data set. Click on that while the main page is active allows us to define the main ‘data source’ query. We might want to include all the data so “select * from atc_trans”
5.4.1.2. Subreport
we should drag the table from the palette into the left top corner of the page.
On the sub-report page, when dragged onto the page, the table will ask us do define a new subset of data from which it pulls the information. For the first one, we put on new dataset with the following query “select sum(at.count) as occurence, at_trans_query_name as code from ... where ... limit by 4”. and the proceed to select all the fields and for the step 3 make sure to check on the “use the same connection as the master report”. Finally is the style where we define the colors and the layout of the table.
Enter the combination “Ctrl+Alt+Page-Up” in order to see the preview of the result.
5.4.1.3. Deployment
Open Windows/JasperReports Server Repo, create a new server connect with username/pwd as “jasperadmin/jasperadmin”.